

GIS and Remote Sensing for Site Characterisation


What is GIS?
A Geographic Information System, or GIS, is a system for storing, managing, analysing and presenting information that has a geographic position. It allows different forms of spatial data to be combined in one framework, such as survey control, satellite imagery, topography, geology, boreholes, wells, drainage, utilities, land use, infrastructure, environmental observations and monitoring results.
GIS is most useful when it links location, attributes, time and interpretation. A point on a map is only useful if its position, source, date, accuracy, meaning and limitations are understood. In site characterisation, GIS helps convert scattered observations into a structured spatial model that can be interrogated, checked and communicated.

What GIS is not
GIS is not a substitute for good data, good field observation or technical judgement.
A GIS can display poor-quality data very convincingly. It can overlay inaccurate datasets, create attractive maps from uncertain observations, and generate contours or surfaces that appear authoritative even when they are poorly constrained. For this reason, GIS should not be treated as a panacea for incomplete, inconsistent or low-quality project data.
The reliability of a GIS output depends on the reliability of the input data. Important limitations include positional accuracy, survey datum, map scale, data age, attribution quality, sampling density, processing method, interpretation assumptions and whether the data actually supports the conclusion being drawn.
Used correctly, GIS helps identify uncertainty and knowledge gaps. Used uncritically, it can create false confidence.
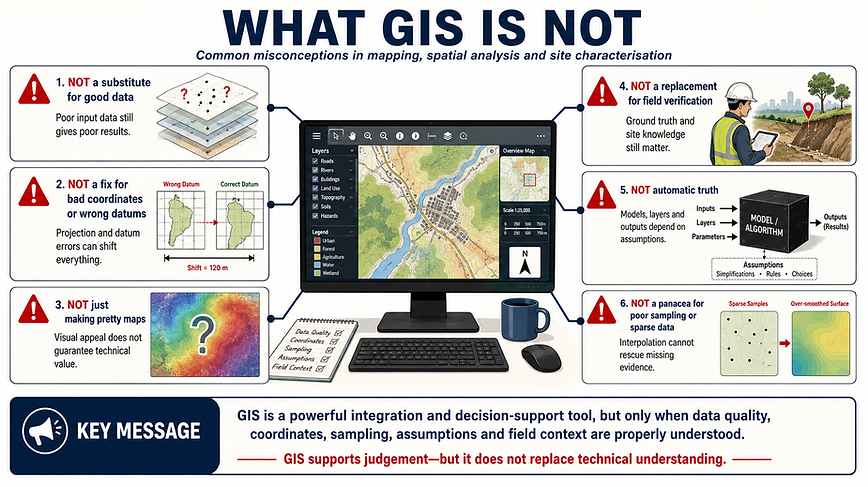
Coordinates, datums and spatial accuracy
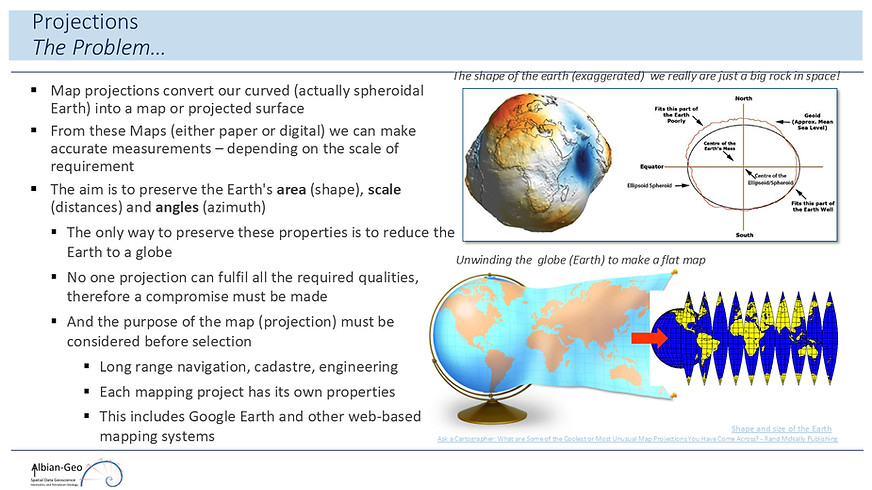
Coordinate systems and datums are fundamental to reliable GIS work. Spatial datasets can only be integrated correctly when the horizontal coordinate reference system, vertical datum, projection, units and transformation parameters are understood.
Small datum or projection errors may be insignificant for regional screening, but they can become critical for engineering design, site investigation, utility mapping, monitoring, earthworks, hydrological modelling, land boundaries and infrastructure setting-out. A dataset may look correctly positioned on screen while still being offset by metres, tens of metres or more if the coordinate reference system is wrong, assumed or poorly documented.
Good GIS practice therefore requires clear metadata, control checks, coordinate-system verification, datum transformation records and an understanding of positional accuracy. Where survey, remote sensing, borehole, environmental and engineering datasets are combined, the spatial framework must be technically defensible.



Spatial conflict avoidance planning. Laser scanning orthophoto, imagery, underground utilities and planned excavations
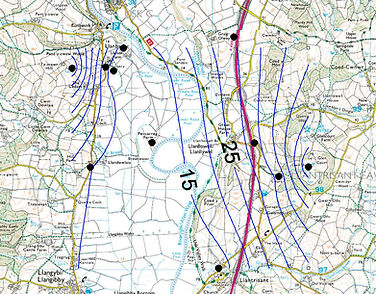
Spatial context. Base mapping, well locations and groundwater contours
Remote sensing provides a valuable first-stage tool for understanding large or difficult sites before detailed fieldwork is undertaken.
Satellite imagery, aerial photography and derived datasets can support interpretation of landforms, drainage patterns, surface disturbance, vegetation change, access constraints, infrastructure, erosion, sediment movement and possible contamination indicators.
Imagery is particularly useful when compared through time.
Changes in land use, flooding, drainage, excavation, vegetation stress, construction activity or surface staining may indicate processes that are not clear from a single site visit or isolated dataset.
Remote sensing should normally be treated as a screening and interpretation tool, not as a complete answer.
Features identified from imagery often require field verification, survey control, sampling or comparison with other evidence before they are used for design or decision-making.

Identification of surface geology
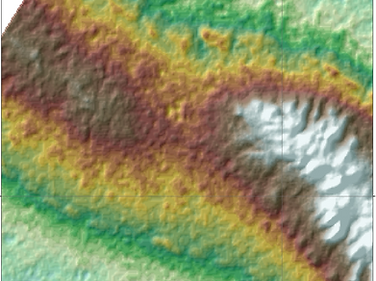
Digital surface model, hill shade and colour tint to aid visualisation

Delineation of faulting for above image- compartmentalisation in oil reservoir
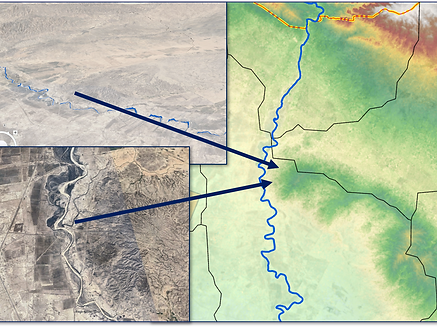
Colourised elevation model, with catchment delineation with 3D visualisation and enlarged imagery. Concept planning for reservoir location

Conceptualised image showing
Terrain, Drainage and Catchment Interpretation
DEM-based assessment of slopes, flow paths, catchment boundaries, flood routes, erosion risk, ponding, recharge potential and site-development constraints.
Digital elevation models and topographic datasets can be used to interpret slopes, drainage routes, catchment boundaries, flood pathways, erosion risk, ponding areas, recharge zones and development constraints.
Terrain interpretation is particularly important where surface water, groundwater, landform evolution and engineering development interact.
Low-relief areas, alluvial plains, wadis, reclaimed land, coastal margins and disturbed industrial sites may contain subtle topographic controls that influence drainage, flooding, infiltration, sediment transport and site accessibility.
GIS-based terrain analysis can support early planning, but the resolution and quality of the elevation data must be understood.
Coarse DEMs may be suitable for regional screening but not for detailed drainage design, earthworks or local flood assessment without higher-quality survey data.
Hydrogeological and Contaminated-Land Screening
Spatial review of aquifers, recharge zones, groundwater vulnerability, land use, possible contaminant sources, pathways, receptors and monitoring priorities.
GIS and remote sensing can support hydrogeological and contaminated-land assessment by combining information on geology, soils, drainage, topography, land use, boreholes, wells, groundwater levels, water quality, potential contaminant sources, pathways and receptors.
This spatial approach helps identify likely recharge areas, groundwater-flow controls, possible contaminant migration routes, monitoring gaps and areas where further investigation should be targeted.
It is also useful for developing and testing conceptual site models.
For contaminated land, GIS can help organise source-pathway-receptor information, but it does not replace field investigation or laboratory testing.
The interpretation must consider ground permeability, depth to groundwater, hydraulic gradient, contaminant properties, preferential pathways, sampling coverage and uncertainty.


Aquifer vulnerability map, georeferenced on digital surface model - identification of areas of concern.


Well location planning. Imagery, existing well locations and digital surface model combined with 3D perspective view to visualise spatial setting

Mapping groundwater pH. Symbols scaled by pH value
Field Investigation and Sampling Support
GIS is a useful tool for planning field investigations because it allows proposed boreholes, trial pits, monitoring wells, geophysical lines, sampling locations and survey control to be compared with existing data and site constraints.
A good investigation layout should not simply be convenient.
It should test the conceptual model, reduce uncertainty and provide adequate spatial coverage for the decisions that need to be made.
GIS helps identify where data are clustered, where gaps exist, where interpolation may be reasonable and where extrapolation beyond the data envelope would be unreliable.
This is particularly important for ground investigation, hydrogeology, contaminated land, geotechnical appraisal and infrastructure planning.
The objective is to collect data that is spatially meaningful, technically defensible and suitable for interpretation.
Decision-Support Mapping and Technical Communication
Preparation of maps, figures, diagrams and spatial outputs that communicate evidence, uncertainty, constraints and recommendations to technical and non-technical audiences.
Maps, figures and spatial models are often the most effective way to communicate complex ground conditions.
They allow technical information to be presented clearly to engineers, environmental specialists, planners, managers and non-specialist stakeholders.
However, decision-support mapping should not hide uncertainty.
Good maps should show enough information for the reader to understand the evidence base, the interpretation, the limitations and the areas where further investigation may be required.
Albian-Geo uses GIS and remote sensing as practical interpretation tools, not as isolated cartographic outputs.
The objective is to convert spatial data into evidence-based understanding that supports investigation, planning, design, risk reduction and technical communication.

Identification of infrastructure from imagery

Map and presentation showing sediment input sources

Map from above image used to locate type geology
Relationship to geo-spatial data quality
GIS and remote sensing are closely linked to the wider issue of geo-spatial data quality. A map, model or spatial database is only as reliable as the data used to create it.
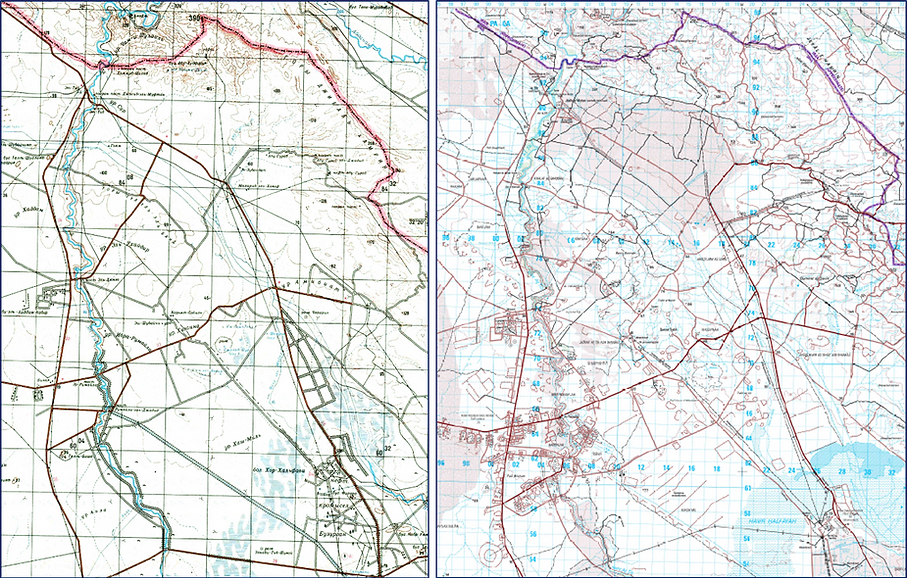
Before digital GIS there was Maps. Same location different scale and vintage - different depiction of essentially the same information
Coordinates and measurements are increasingly extracted directly from digital GIS platforms, but their apparent precision should not be mistaken for accuracy.
The underlying spatial data still inherits the limitations of its original source, including map scale, survey method, datum, resolution, digitising accuracy and positional uncertainty.
A modern digital interface does not remove the need to understand traditional map accuracy, coordinate reliability and the limits of measurement from spatial datasets.

Poor georectification of Google Earth Imagery 5km to the northeast of Mizhrichyntska Licence Block. Note displacement of road alignment of approximately 50m
Important questions include:
-
What is the source of the data?
-
How was the data collected?
-
What coordinate system and datum were used?
-
What is the positional accuracy?
-
Georeferencing quality?
-
What scale or resolution is appropriate?
-
When was the data collected?
-
How complete is the attribution?
-
Are the observations independent?
-
Is the spatial distribution adequate?
-
Are the results interpolated between observations or extrapolated beyond them?
-
Are apparent patterns real, or are they artefacts of sampling, processing or display?
These questions are central to reliable site characterisation.
The first benefit of investigation is not simply increased confidence, but the removal of false confidence.


Accurate survey overlain on Google Earth – relative and absolute accuracies are involved. Note the vector shift. There is about a 3+m difference. Geomatics can advise!